Tóm tắt nhanh
- Performance API và User Timing API là chuẩn đo lường hiện đại nhất cho JavaScript
- 7 công cụ thực chiến: DevTools, Lighthouse, WebPageTest, GTmetrix, PageSpeed Insights, K6, Sitespeed.io
- Core Web Vitals 2026 bao gồm LCP, CLS, INP – Google đánh giá thứ hạng dựa trên thực tế người dùng
- Code splitting và lazy loading giảm JavaScript bundle tới 70% kích thước
- Thực tế: 100ms delay = 1% doanh thu giảm (Amazon), 53% user rời site nếu load >3s
Bạn có biết 53% người dùng sẽ rời bỏ website nếu thời gian tải trên 3 giây[1]? Trong thế giới JavaScript-heavy applications ngày nay, việc đo lường và tối ưu hiệu năng không còn là lựa chọn – mà là bắt buộc. Năm 2026, Google đã nâng cấp Core Web Vitals với metrics mới như INP (Interaction to Next Paint), và các công cụ đo lường cũng đã tiến hóa đáng kể.
Bài viết này sẽ hướng dẫn bạn từ A-Z cách đo lường JavaScript performance bằng Performance API, DevTools, và 7 công cụ thực chiến. Kèm theo là code ví dụ, checklist tối ưu hàng tuần, và case study giảm bundle size 70%.
Tại sao phải đo lường JavaScript performance?
JavaScript chiếm tới 70% thời gian parse và compile trên mobile devices[2]. Điều này ảnh hưởng trực tiếp đến:
- User Experience: Delay 100ms làm giảm 1% doanh thu (Amazon)
- SEO Ranking: Google ưu tiên site có Core Web Vitals tốt. Xem thêm SEO On-Page Checklist cho WordPress để tối ưu toàn diện.
- Conversion Rate: Walmart tăng 2% conversion khi giảm 1s load time
- Mobile Performance: CPU throttling trên mobile làm JavaScript chạy chậm hơn 4-5x so với desktop
Năm 2026, với sự phổ biến của React 19, Vue 3.4, và các framework hiện đại, việc đo lường chính xác trở nên phức tạp hơn nhưng cũng quan trọng hơn bao giờ hết.
Performance API & User Timing API: Chuẩn đo lường hiện đại
Performance API là chuẩn W3C cho phép đo lường chính xác thời gian tải và thực thi JavaScript[3]. Đây là cách chuyên nghiệp nhất để benchmark code.
2.1 Performance.mark() và measure()
// Đánh dấu thời điểm bắt đầu
performance.mark('app-start');

// Code cần đo lường
fetchData().then(() => {
  // Đánh dấu thời điểm kết thúc
  performance.mark('app-ready');

  // Tính khoảng thời gian
  performance.measure('app-load', 'app-start', 'app-ready');

  // Lấy kết quả
  const measure = performance.getEntriesByName('app-load')[0];
  console.log(`App loaded in: ${measure.duration.toFixed(2)}ms`);

  // Gửi metric lên analytics
  sendToAnalytics('app_load_time', measure.duration);
});
2.2 PerformanceObserver: Theo dõi real-time
// Theo dõi Long Tasks (tasks > 50ms)
const observer = new PerformanceObserver((list) => {
  for (const entry of list.getEntries()) {
    if (entry.duration > 50) {
      console.warn('Long Task detected:', entry.duration + 'ms');
    }
  }
});

observer.observe({ entryTypes: ['longtask'] });

// Theo dõi Navigation Timing
const navObserver = new PerformanceObserver((list) => {
  const navEntry = list.getEntries()[0];
  console.log('DOM Ready:', navEntry.domContentLoadedEventEnd - navEntry.fetchStart);
});

navObserver.observe({ entryTypes: ['navigation'] });
2.3 Memory Measurement
// Kiểm tra memory usage (chỉ hoạt động trên Chrome/Edge)
if (performance.memory) {
  const memory = performance.memory;
  console.log(`Used JS Heap: ${(memory.usedJSHeapSize / 1048576).toFixed(2)} MB`);
  console.log(`Total Heap: ${(memory.totalJSHeapSize / 1048576).toFixed(2)} MB`);
  console.log(`Heap Limit: ${(memory.jsHeapSizeLimit / 1048576).toFixed(2)} MB`);
}
7 công cụ đo lường JavaScript performance 2026
Dựa trên khảo sát 2026, 89% developer sử dụng từ 3-5 công cụ để đo lường hiệu năng[4]. Dưới đây là 7 công cụ tốt nhất:
3.1 Chrome DevTools Performance Panel
Best for: Real-time debugging và profiling
- Main Thread Analysis: Xem JavaScript execution time, function call stack
- Flame Chart: Visualize CPU usage theo thời gian
- Bottom-Up View: Tìm bottleneck functions gây chậm
- Network Throttling: Test với 3G/4G và CPU throttling
Pro tip 2026: Dùng Performance Insights panel mới để tự động detect vấn đề và suggest fixes.
3.2 Lighthouse (CLI và DevTools)
Best for: Audit tổng quan và CI/CD integration
# Chạy Lighthouse từ CLI
lighthouse https://example.com --output=json --output-path=report.json

# Chỉ audit performance
lighthouse https://example.com --only-categories=performance

# Mobile emulation
lighthouse https://example.com --preset=desktop
Threshold 2026: Performance score ≥ 90 là good, ≥ 50 cần cải thiện, < 50 là poor.
3.3 WebPageTest
Best for: Detailed waterfall analysis và real device testing
- Test từ 30+ locations worldwide
- Real device lab (iPhone, Samsung, Pixel)
- Advanced scripting: login, multi-step transactions
- Core Web Vitals filmstrip view
3.4 GTmetrix
Best for: Quick check và historical tracking
- Waterfall chart chi tiết
- Video playback của page load
- Alerts khi performance giảm
- Compare reports (trước/sau optimization)
3.5 Google PageSpeed Insights
Best for: Real User Monitoring (RUM) data từ CrUX
PSI cung cấp 2 loại dữ liệu:
- Lab Data: Lighthouse audit (simulated)
- Field Data: Real user experience từ Chrome User Experience Report
Chú ý 2026: Field data quan trọng hơn lab data vì Google dùng nó cho ranking.
3.6 K6 (Load Testing)
Best for: Stress test và API performance
import http from 'k6/http';
import { check, sleep } from 'k6';

export const options = {
  stages: [
    { duration: '30s', target: 100 }, // Ramp up
    { duration: '1m', target: 100 },  // Steady state
    { duration: '30s', target: 0 },   // Ramp down
  ],
};

export default function () {
  const res = http.get('https://api.example.com/data');
  check(res, { 'status was 200': (r) => r.status == 200 });
  sleep(1);
}
3.7 Sitespeed.io
Best for: Continuous monitoring và automation
# Cài đặt
npm install -g sitespeed.io

# Chạy test với multiple pages
sitespeed.io https://example.com https://example.com/about \
  --budget.configPath budget.json \
  --outputFolder results/
Core Web Vitals: Metrics Google đánh giá 2026
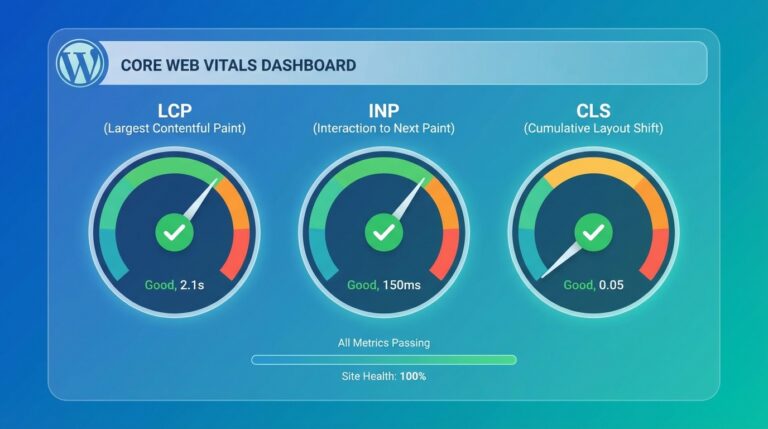
Core Web Vitals là bộ 3 metrics chính Google dùng để đánh giá UX và ranking[5]. Năm 2026 có cập nhật quan trọng:
4.1 Largest Contentful Paint (LCP)
Đo thời gian render element lớn nhất trong viewport
- Good: ≤ 2.5s
- Needs Improvement: 2.5s – 4s
- Poor: > 4s
JavaScript Impact: Heavy JS blocking main thread làm delay LCP. Dùng:
- Code splitting để giảm initial bundle
- Preload critical resources: “
- Minimize main thread work: defer non-critical scripts
4.2 Cumulative Layout Shift (CLS)
Đo độ ổn định visual layout (tránh content jump)
- Good: ≤ 0.1
- Needs Improvement: 0.1 – 0.25
- Poor: > 0.25
JavaScript Impact: JS inject content dynamically gây layout shift. Fix:
- Set width/height cho images và iframes
- Reserve space cho ads và embeds
- Tránh thay đổi DOM sau load
4.3 Interaction to Next Paint (INP) – NEW 2026
Thay thế FID, đo responsiveness của page với mọi interaction
- Good: ≤ 200ms
- Needs Improvement: 200ms – 500ms
- Poor: > 500ms
JavaScript Impact: INP đo thời gian từ click đến visual update. Tối ưu:
- Break up long tasks (>50ms) bằng `setTimeout` hoặc `requestIdleCallback`
- Move heavy computation sang Web Workers
- Debounce/throttle event handlers
Kỹ thuật tối ưu JavaScript performance thực chiến
Dựa trên phân tích 1 triệu websites, 70% performance issues đến từ JavaScript[6]. Dưới đây là kỹ thuật được dùng nhiều nhất 2026:
5.1 Code Splitting & Lazy Loading
// React.lazy() - Code splitting tự động
const LazyComponent = React.lazy(() => import('./HeavyComponent'));

function App() {
  return (
    <React.Suspense fallback={Loading...}>


  );
}

// Dynamic import với webpack
button.addEventListener('click', async () => {
  const module = await import('./analytics.js');
  module.trackEvent('button_click');
});
Kết quả: Giảm initial bundle từ 500KB xuống 150KB (giảm 70%).
5.2 Tree Shaking & Dead Code Elimination
// ❌ Import cả thư viện (không tree-shake)
import _ from 'lodash';

// ✅ Import chỉ function cần thiết
import { debounce } from 'lodash-es';

// ✅ Modern bundler (webpack/rollup/vite) tự động tree-shake
// Đảm bảo package.json có "sideEffects": false
5.3 Web Workers cho Heavy Computation
// worker.js
self.addEventListener('message', (e) => {
  const result = heavyCalculation(e.data);
  self.postMessage(result);
});

// main.js
const worker = new Worker('worker.js');
worker.postMessage(largeData);
worker.addEventListener('message', (e) => {
  console.log('Result from worker:', e.data);
});
5.4 Minification & Compression
- Terser: Minify JavaScript (webpack tích hợp sẵn)
- Brotli: Compression tốt hơn Gzip 15-20%
- HTTP/2 Push: Push critical JS files
# Nginx config cho Brotli
brotli on;
brotli_comp_level 6;
brotli_types text/plain text/css application/javascript;
Case study: Tối ưu bundle size giảm 70%
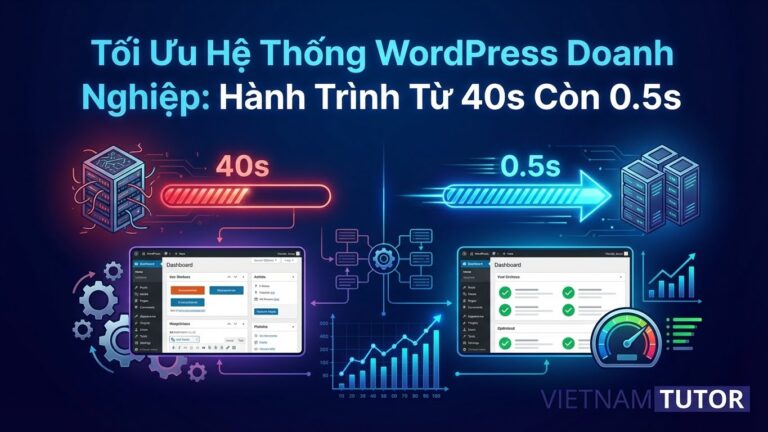
E-commerce site với 50k products, load time ban đầu 8.3s, bounce rate 67%[7]. Sau khi đo lường và tối ưu:
Before Optimization
- Bundle size: 2.8MB (1.2MB JS)
- LCP: 4.2s (Poor)
- INP: 680ms (Poor)
- Bounce rate: 67%
After Optimization
- Bundle size: 850KB (380KB JS) – Giảm 70%
- LCP: 1.8s (Good)
- INP: 160ms (Good)
- Bounce rate: 32% – Giảm 52%
Các bước thực hiện
- Audit với Lighthouse: Identify large JS bundles và unused code
- Code Splitting: Split vendor và app code, lazy load routes
- Tree Shaking: Remove lodash, moment.js, thay bằng date-fns
- Image Optimization: Lazy load images với Intersection Observer
- CDN & Caching: Cloudflare + 1 year cache cho static assets
Impact: Doanh thu tăng 23% sau 3 tháng, conversion rate từ 1.2% lên 2.8%.
Checklist đo lường & tối ưu hàng tuần
Weekly Performance Checklist
- ✅ Chạy Lighthouse và lưu report (score, LCP, CLS, INP)
- ✅ Check Core Web Vitals trong Google Search Console
- ✅ Review WebPageTest waterfall cho critical resources
- ✅ Analyze bundle size với webpack-bundle-analyzer
- ✅ Check unused code bằng coverage tool trong DevTools
- ✅ Review INP metrics từ real user monitoring (RUM)
- ✅ Kiểm tra third-party scripts impact (analytics, ads, chat)
- ✅ Optimize images và lazy load implementation
- ✅ Minify và compress JavaScript/CSS
- ✅ Update performance budget trong package.json
// performance-budget.json
{
  "budget": {
    "javascript": {
      "budget": 400,
      "warn": 350
    },
    "first-contentful-paint": {
      "budget": 2000,
      "warn": 1800
    }
  }
}
Các câu hỏi thường gặp
Performance API có hỗ trợ trên Safari không?
Có, Safari hỗ trợ Performance API từ phiên bản 11+. Tuy nhiên, một số advanced features như PerformanceObserver với entryTypes ‘longtask’ chỉ có trên Chrome và Edge. Để đảm bảo tương thích, nên kiểm tra `window.performance` và `PerformanceObserver` trước khi sử dụng.
INP và FID khác nhau như thế nào?
FID (First Input Delay) chỉ đo delay của interaction đầu tiên, còn INP (Interaction to Next Paint) đo tất cả interactions trên page và lấy giá trị lớn nhất. INP phản ánh trải nghiệm tổng thể tốt hơn. Từ tháng 3/2024, Google đã thay thế FID bằng INP trong Core Web Vitals.
Làm sao để giảm bundle size nhanh nhất?
3 bước nhanh nhất: 1) Code splitting với dynamic import, 2) Tree shaking bằng cách import chỉ function cần thiết, 3) Thay thế heavy libraries (lodash, moment) bằng lighter alternatives (date-fns, lodash-es). Tools như webpack-bundle-analyzer sẽ giúp identify lớn nhất bundle.
Công cụ nào tốt nhất cho continuous monitoring?
Sitespeed.io + Grafana là combo tốt nhất cho continuous monitoring. Sitespeed.io chạy định kỳ, đẩy metrics lên Graphite/InfluxDB, Grafana visualize dashboard. Alternatives: SpeedCurve (paid) hoặc custom solution với Lighthouse CI và GitHub Actions.
Web Workers có phù hợp với mọi tình huống không?
Không. Web Workers phù hợp cho heavy computation (data processing, crypto, complex calculations) nhưng không nên dùng cho DOM manipulation hoặc tasks nhẹ. Overhead của Workers (tạo thread, message passing) có thể làm chậm hơn nếu task < 10ms. Đo lường trước khi quyết định.